
In the week of 10th–16th October 2026, our retained feed records contain two confirmed Brazil-phishing cases. In the following week, they contain 47. Both weeks precede Brazil's 25th October runoff, but the way we collected cases was changing too.
Most of the later confirmed cases came through sources that supplied nothing to the earlier week's intake. The increase describes a real change in what Sandfish observed. To understand what it says about phishing before the election, we first need to understand how a case reached the count.
What enters the count
Sandfish receives candidate URLs from external feeds and accepts some for analysis. We call each new accepted analysis an admission. The date records when it entered our system, not when the site began operating.
For this comparison, we counted new automatic-feed admissions and excluded repeat captures and derived analyses. We then used our later review to identify confirmed phishing aimed at Brazil among those records. The labels are retrospective; they do not describe what was known when each URL arrived. The method and aggregate counts specify the selection.
The total intake grew between the two weeks. Even after allowing for that growth, the confirmed-case yield rose: from 0.45 to 6.27 reviewed confirmed cases per 1,000 admissions. That is a useful description of our collection, provided we keep its source mix in view.
Most later cases came from newly present sources
OpenPhish and URLscan contributed admissions in both weeks. VirusTotal, PhishTank, and PhishDestroy contributed only in the later week of this comparison. Those three sources supplied 39 of the later 47 confirmed cases.
The table shows where the confirmed cases entered the collection:
| Confirmed cases by source | 10th–16th October | 17th–23rd October |
|---|---|---|
| OpenPhish and URLscan | 2 | 8 |
| VirusTotal, PhishTank, and PhishDestroy | 0 | 39 |
| Other sources | 0 | 0 |
| Total confirmed cases | 2 | 47 |
| Total admissions, all classifications | 4,472 | 7,494 |
Complete weeks in October 2026, UTC. Counts use new automatic-feed admissions and retrospective review labels. A zero confirmed count does not make every admission a verified negative. Aggregate source data.
“Newly present” describes these sources in our intake. It does not mean that their providers or the phishing sites were new. A newly included feed can introduce records of sites that were already operating.
This changes the meaning of the pooled increase. Most later confirmed cases arrived through sources absent from the earlier comparison. We can identify that contribution, but cannot tell how many of those sites another source would eventually have supplied.
Keeping the same sources changes the comparison
To reduce that difference, we compared OpenPhish and URLscan alone. Their confirmed count still rose, from two to eight. Their intake also grew, and confirmed-case yield rose from 0.45 to 1.22 per 1,000 admissions.
The uncertain cases complicate that result. We kept a separate plausible category for cases that did not meet the confirmed classification. When we include those alongside confirmed cases, the combined count rises from 14 to 18, but its yield falls from 3.13 to 2.75 per 1,000 admissions. Intake grew faster than the combined count.
These two comparisons belong together. One shows an increase among confirmed cases. The other shows how including the uncertain category changes the result. It is not a reason to relabel plausible cases as confirmed, or to conclude that phishing declined.
There is a further limit: we did not deeply review every admission. Relevant terms and available evidence helped select cases for review, so an unreviewed record cannot be treated as a negative finding. Other phishing cases can remain outside both categories.
Our collection audit also records changes in search queries, intake capacity, delays, and capture behavior. Keeping the same feed names therefore does not keep the entire observation process fixed. It narrows the comparison without turning it into a national sample.
What this says about the election
The investigation found documented electoral lures, including false-fee claims using election-related pretexts. Those examples establish that the lures existed. They do not measure how much phishing occurred across Brazil or what share the election caused.
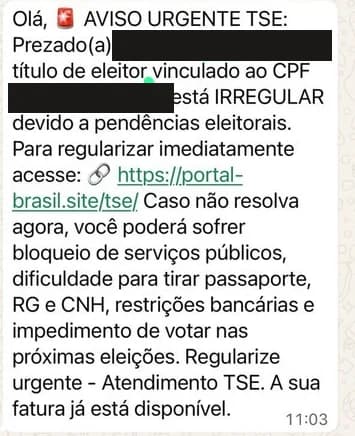
A false message illustrated in TSE's warning. The image is cropped and identity fields are covered. It documents an electoral pretext; it is not a case added to our weekly table. Source and image method.
Our feed records answer a narrower question: what did this collection contain under the recorded conditions? The answer is more confirmed Brazil-phishing cases in the later week, with most coming through newly present sources.
The underlying threat could also have changed; our records do not measure that change. A national estimate would need a comparable observation method across periods. An electoral explanation would also need to test other possible causes.
The useful result is the count together with the process that produced it. The movement from two cases to 47 becomes understandable when we show where those cases came from, how they were selected, and what remains unreviewed.
Source notes
The method note defines the population, retrospective labels, source groups, and yield calculation. The aggregate data let readers reproduce the table and rates. They do not include the underlying case-review records and cannot independently validate those labels. Failed and incomplete captures remain in the admission totals.
The cohort cutoff is 2026-10-24T11:33:28Z, exclusive. The weekly comparison
ends at midnight UTC before 24th October. The partial day, later research
captures, generated invoices, and archive refreshes add no arrivals to these
two weeks.
Together, OpenPhish and URLscan supplied 4,472 admissions in the earlier week and 6,538 in the later week. Deep review covered 121 earlier admissions and 261 later admissions across all sources, selected rather than random.
A separate Brasília calendar check gives 2 confirmed cases in 4,530 admissions and 50 in 7,526. It preserves the source-composition interpretation. The method note records this sensitivity alongside the primary UTC comparison.